September Market Update from IFA |
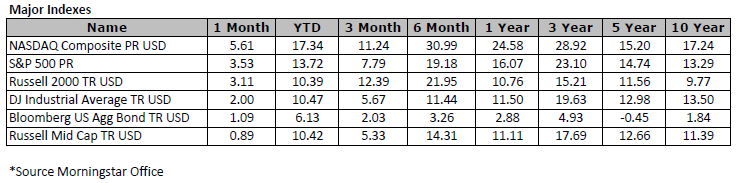
Week 1 U.S. equities posted modest gains this week as investors digested a blend of corporate developments, economic indicators, and increasingly firm expectations for a Federal Reserve rate cut in September. The S&P 500 ticked up 0.3%, while the Nasdaq Composite led the charge with a 1.1% rise, fueled by strength in mega-cap tech stocks. In contrast, the Dow Jones Industrial Average slipped 0.3%, but broader market participation was evident as small- and mid-cap indices outperformed—the Russell 2000 climbed 1.0%, and the S&P MidCap 400 advanced 1.3%. Recent data reinforced the case for monetary easing. August nonfarm payrolls came in sharply below expectations at 22,000 (vs. 78,000 consensus), and private payrolls rose just 38,000 (vs. 90,000 consensus), accompanied by subdued wage growth. These figures pushed the probability of a September rate cut to 100%, according to the CME FedWatch Tool. However, mixed readings from ISM services, ADP employment, and productivity reports added complexity to the economic picture, tempering investor enthusiasm. The Federal Reserve is widely expected to cut interest rates multiple times this year to support a slowing economy. Traders now assign a 67% probability to three rate cuts and a 9% chance of a full percentage point reduction—an outcome that seemed far-fetched just days ago. Despite the dovish outlook, underlying economic fragility remains a concern. For the first time since 2021, the number of unemployed Americans now exceeds available job openings. This summer’s deceleration in job growth has prompted a shift in expectations: rather than spacing out cuts at alternate meetings, Fed officials may now consider back-to-back quarter-point reductions at their October and December gatherings
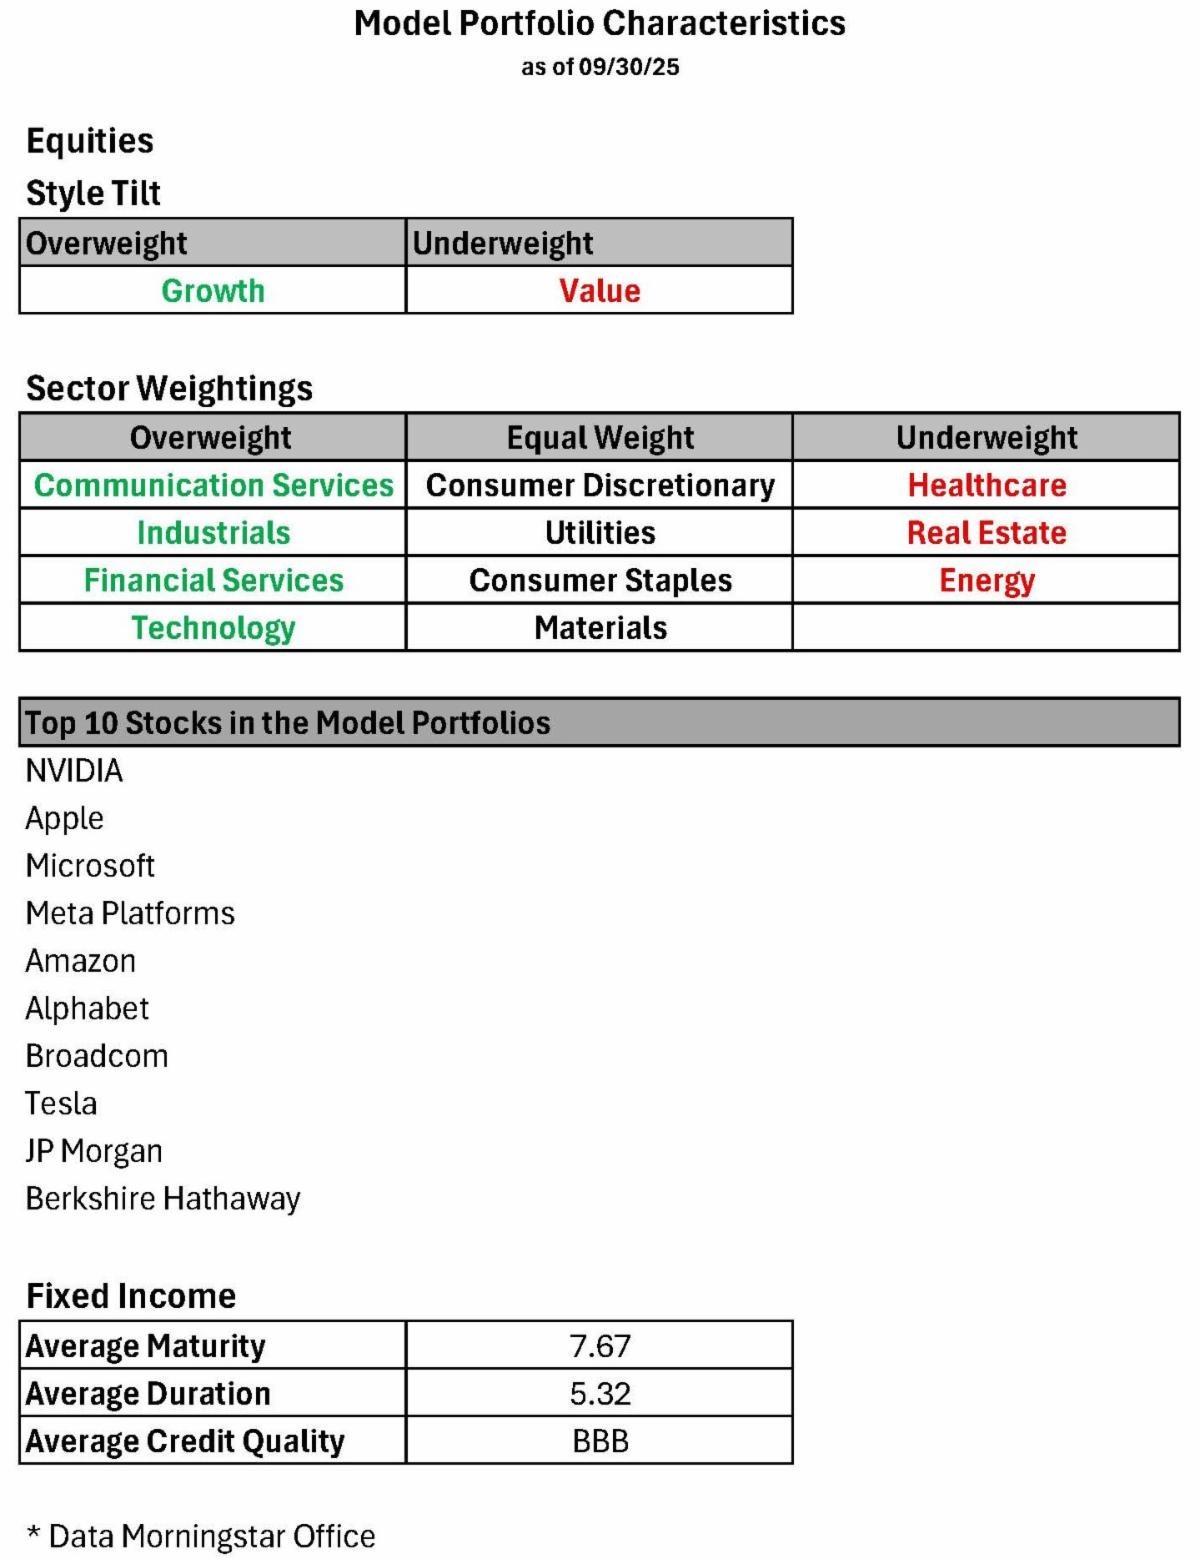
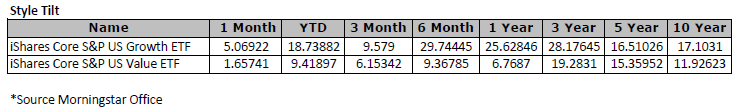
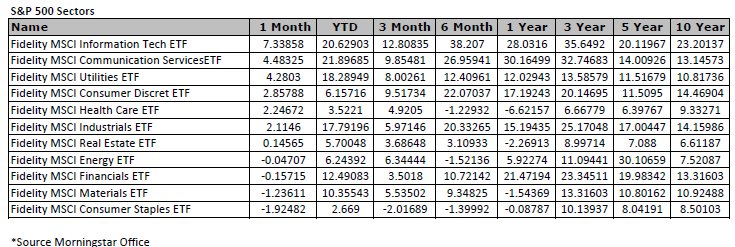
Week 2 U.S. equities delivered a broadly positive performance this week, led by robust gains in the tech-heavy Nasdaq Composite (+2.0%) and the S&P 500 (+1.6%). The Dow Jones Industrial Average also advanced (+1.0%), while smaller-cap indices posted more muted results. The Russell 2000 edged up just 0.3%, and the S&P MidCap 400 slipped 0.4%, underscoring the market’s growing dependence on mega-cap strength. That trend was further reflected in the S&P 500 Equal Weight Index (+0.3%), which lagged its market-weighted counterpart. Economic indicators continued to support the case for further monetary easing. Although August’s Producer Price Index (PPI) came in slightly hotter than expected at 0.4% (vs. 0.3% consensus), Core CPI matched forecasts at 0.3%. More notably, initial jobless claims surged by 27,000 to 263,000 — marking the highest level since October 2021 and exceeding the consensus estimate of 240,000. This spike reinforced expectations for rate cuts through year-end, helping propel the S&P 500, Nasdaq Composite, and DJIA to fresh record highs. However, beneath the surface, troubling signs are emerging. On Tuesday, the Bureau of Labor Statistics revised down its estimate of job gains for the 12 months ending March 2025 by a staggering 911,000. This sharp downward adjustment suggests hiring has been significantly weaker than previously believed, as businesses remain cautious amid tepid demand. The data paints a picture of a late-stage economic cycle—one where growth has persisted for years but is now showing signs of fatigue. If the slowdown deepens, recession fears could begin to take hold across markets, boardrooms, and households. With job growth faltering and other indicators flashing warning signals, the economy may be approaching a critical inflection point. Week 3 The stock market wrapped up the week with strong gains, buoyed by renewed clarity on monetary policy following Wednesday’s FOMC decision. As anticipated, the Federal Reserve lowered the target range for the federal funds rate by 25 basis points to 4.00–4.25%. Investors quickly shifted focus to the Fed’s updated guidance, which revealed a split among officials: nine anticipate one more cut this year, ten project two, and one expects none. Post-announcement, CME FedWatch Tool probabilities surged — pricing in a 91.9% chance of an October cut and an 80.6% likelihood of another in December. Sector performance was led by communication services (+3.4%) and information technology (+2.1%), driven by standout weekly gains in Alphabet (+4.0%) and Apple (+3.6%). Consumer discretionary also posted a solid advance (+1.5%). Meanwhile, defensive and cyclical sectors lagged: consumer staples (-1.3%), real estate (-1.4%), and materials (-0.9%) all declined. Major indices closed the week at fresh record highs:
The Russell 2000’s breakout underscored growing risk appetite and broadened market participation beyond mega-cap tech. This week’s rally was defined by:
Macro data continued to shape expectations for future rate adjustments, reinforcing the market’s bullish tone while leaving room for debate on the pace of cuts ahead.
Week 4 U.S. equities experienced a volatile week, oscillating between record highs and midweek pullbacks. Early enthusiasm was driven by tech and AI headlines, with NVIDIA, Apple, and Oracle leading the charge on Monday as the S&P 500 and Nasdaq set fresh records. However, momentum faded midweek as valuation concerns, hawkish Fed commentary, and surprisingly strong economic data weighed on sentiment. Following last week’s 25-basis-point rate cut, traders continue to anticipate two more reductions in October and December. Economic data released Friday reinforced the view that the U.S. economy remains resilient, complicating the Fed’s path forward. Treasury yields were largely stable, with the 10-year note edging up to 4.185% from 4.138% a week earlier, reflecting cautious optimism without triggering a bond selloff. Despite September’s reputation as the weakest month for equities, all three major indexes are on track for a strong monthly close. Investor optimism around rate cuts and robust corporate earnings has fueled repeated highs, even as underlying concerns persist. The disconnect between market performance and economic anxiety is prompting some investors to tread carefully. Looking ahead, October looms large. Historically marked by heightened volatility and infamous market crashes—1987, 1997, and 2008—October also concludes the “worst six months” of the year, according to the Stock Trader’s Almanac. With policy risks such as tariffs and a potential government shutdown in play, the coming weeks could test the market’s resilience. *This content is developed from sources believed to be providing accurate information. It may not be used for the purpose of avoiding any federal tax penalties. Please consult legal or tax professionals for specific information regarding your individual situation. The opinions expressed and material provided are for general information, and should not be considered a solicitation for the purchase or sale of any security. |
|
|
|
|
|