August Market Update from IFA |
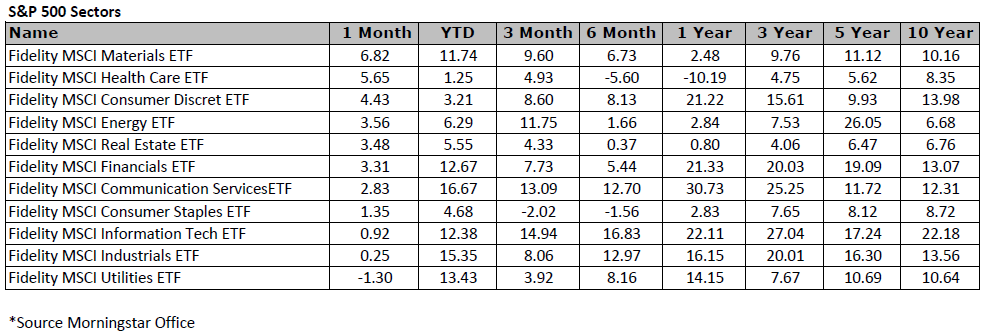
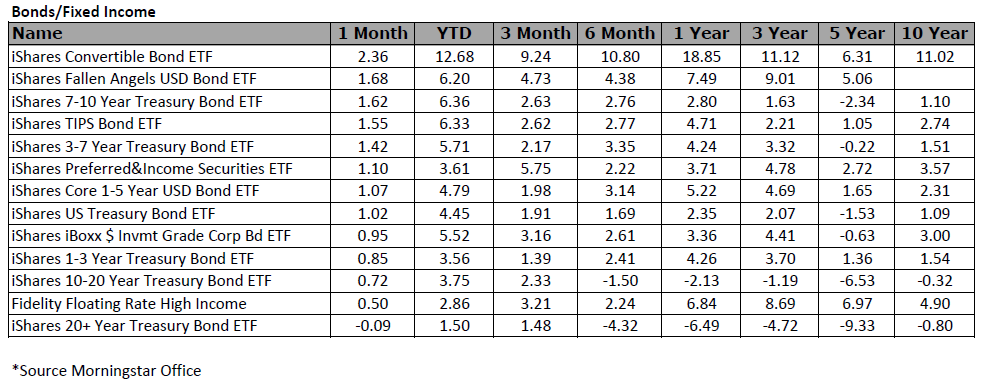
Week 1 The equity market regained its footing this week, lifted by a persistent "buy the dip" mentality, resilient earnings sentiment, and renewed leadership from mega-cap stocks. After last week’s pullback, the S&P 500 rose 2.4% to finish just shy of a new all-time closing high, while the Nasdaq Composite surged 3.9% to notch a new record. The Dow Jones Industrial Average added 1.4%, the Russell 2000 rose 2.4%, and the S&P Midcap 400 advanced 0.6%. Most S&P 500 sectors participated in the rebound. The information technology sector led with a 4.3% gain, followed by the consumer discretionary (+3.8%), communication services (+3.3%), consumer staples (+3.1%), and materials (+2.4%) sectors. The financial sector rose 0.7%, and utilities added 0.4%. Real estate (-0.1%), energy (-1.0%), and health care (-0.8%) were the only sectors to post losses. Treasury yields rose modestly this week, giving back some of their post-nonfarms payrolls report gains. The 2-year yield increased six basis points to 3.76%, and the 10-year yield rose seven basis points to 4.29%. But is Wall Street too sanguine about the near-term outlook? The Cboe Volatility Index, or VIX, was on track to end the week trading around 16, a level that indicates the absence of fear in the stock market, after closing the previous week above 20. It’s a no-worries market, but that might be the right vibe. August and September tend to be stormier months for the market. But as long as U.S. corporations maintain a relatively upbeat outlook, investors should just hold on tight and wait for those late summer stock squalls to pass. Week 2 The equity market advanced modestly this week, buoyed by a combination of positive inflation data, resilient earnings, and continued rotation into smaller-cap and cyclical names. The S&P 500 rose 0.9%, the Nasdaq Composite gained 0.8%, and the DJIA outperformed with a 1.7% advance. Mid- and small-cap stocks led the way, with the S&P Mid Cap 400 climbing 1.6% and the Russell 2000 surging 3.1%, signaling renewed risk-on sentiment following the July CPI report. The CPI data, largely in line with expectations, provided the initial spark for this week’s rally. Total CPI increased 0.2% month-over-month (Briefing.com consensus 0.2%), while core CPI, which excludes food and energy, rose 0.3% month-over-month (Briefing.com consensus 0.3%). These readings kept year-over-year headline inflation at 2.7% and core inflation at 3.1%, giving markets confidence in the likelihood of a 25-basis-point rate cut at the September FOMC meeting and fueling a rotation toward sectors and stocks poised to benefit from a friendlier interest rate environment. Midweek, the release of the July PPI report tempered some of the enthusiasm from the CPI-driven rally. The PPI for final demand jumped 0.9% month-over-month (Briefing.com consensus 0.2%), with the PPI less food and energy also rising 0.9% month-over-month, compared to an unchanged reading in June. These readings pushed year-over-year PPI growth to 3.3% (headline) and 3.7% (less food and energy), suggesting wholesale inflation pressures remain elevated. In response, markets modestly reduced expectations for the magnitude of the upcoming rate cut, with the CME FedWatch Tool showing the probability of a 25-basis-point cut at the September FOMC meeting, declining slightly to 84.9% by Friday, down from 99.9% earlier in the week. U.S. Treasuries fluctuated modestly in response to the interplay of CPI and PPI data, with rate cut expectations still elevated but slightly moderated. Yields on the 2-year note were essentially unchanged for the week at 3.76%, while the 10-year note ended the week slightly higher at 4.33%. Week 3 The equity market finished the week with a modest risk-on tone, supported by small- and mid-cap strength and optimism across select cyclical sectors. The Russell 2000 surged 3.3% week-to-date and the S&P Mid Cap 400 climbed 2.6%, signaling broad support for domestically oriented stocks, while the DJIA rose 1.5%, finishing the week with fresh record highs, and the S&P 500 added 0.3%. The Nasdaq Composite lagged slightly, retreating 0.6% week-to-date, reflecting ongoing headwinds for mega-cap technology. Small-cap and cyclical sectors led the advance. The iShares U.S. Home Construction ETF gained 3.0%, while consumer discretionary rose 1.3%, underscoring interest in sectors positioned to benefit from a potentially more accommodative policy stance. The financials (+2.1%), industrials (+1.8%), materials (+2.1%), and energy (+2.8%) sectors also contributed meaningfully to the week’s gains. Conversely, defensive and large-cap technology names lagged. The information technology sector fell 1.6%, the communication services sector retreated 0.9%, and the Vanguard Mega Cap Growth ETF closed the week down 1.1%, reflecting continued rotation away from mega-cap and tech-heavy indices toward smaller and more cyclical stocks. Treasuries moved with the Fed-driven sentiment, as the 2-year note yield fell to 3.69% and the 10-year note settled to 4.26% by Friday, balancing elevated rate cut expectations against ongoing inflation concerns. Fear was in control during the first few days of this past week. Artificial-intelligence fever had turned into AI flu, causing Nvidia stock to drop for three consecutive days and the rest of the Mag Seven to stumble. Then, Federal Reserve Chair Jerome Powell’s speech at Jackson Hole suggested he was leaning toward a September interest-rate cut, sending stocks roaring back. The gains were broad-based, with everything from tech shares to oil to bitcoin climbing. More than 420 stocks in the S&P 500 took part in the rally, according to FactSet. But the moves were most concentrated in areas poised to benefit from a decline in borrowing costs. Shares of smaller companies, which are often sensitive to the economy’s health, surged. The Russell 2000 index of smaller stocks jumped 3.9%, beating the S&P 500’s daily gain by the widest margin since November. Week 4 The Dow Jones Industrial Average fell about 0.3% this week, dragged lower by a Friday selloff following another report showing persistent inflation pressures. The S&P 500 and Nasdaq Composite were each down 0.1%. Despite the downbeat end of the month, all three indexes have rallied between 1.5% and 3% in August and are near record highs. Now it’s off to September, historically the worst month for stocks. It’s easy to list the reasons it could live up to its reputation—but investors are counting on the Federal Reserve to save the day with a rate cut when its meeting ends on Sep. 17. The S&P 500’s march to a record high this year hasn’t come cheap: By some measures, stocks have never been pricier. Price-to-earnings ratios aren’t quite at records—thanks to juicy profit margins at many of the index’s most valuable companies—but they still sit at the extreme end of history. The S&P 500 currently trades at 22.5 times its projected earnings over the next 12 months, compared with the average of 16.8 times since 2000. Many investors say the biggest U.S. stocks, most of which are technology companies, are worth every penny. Companies like Nvidia and Microsoft are still boosting sales and profits at a rapid pace, and they have come to dominate the market. The 10 largest companies in the S&P 500 accounted for 39.5% of its total value at the end of July, the most ever, according to Morningstar. Nine have a market capitalization above $1 trillion. The S&P 500 is on pace to end August 2% higher after rising 2.2% in July. The benchmark is also on pace for its fourth straight monthly advance. But the index typically averages a 0.7% decline in September, making it the worst month of the year historically, according to the Stock Trader’s Almanac. With the S&P 500′s July and August rallies, September could bring even rougher waters based on historical patterns. Looking only at years when the broad index gained more than 2% in both July and August, that average September slide increases to 1%. Of those 11 years going back to 1949, all but three have ended in the red. Additionally, seven of those 11 years had a negative October. The average loss for the month was 2.9%. If you blinked earlier this year, you missed a great opportunity to buy stocks. The S&P 500 tumbled 19% between mid-February and early April due to fears about changing trade policy and President Donald Trump’s “Liberation Day” tariff announcement. But the blue-chip index, along with the Dow Jones Industrials and Nasdaq Composite, have come roaring back to near-record highs. The S&P 500 is now up 10% year to date, led by gains in the megacap technology stocks Nvidia, Microsoft, Meta Platforms, Broadcom, and Palantir Technologies. Earnings for the Magnificent Seven are expected to increase 24% this year, compared with just under 7% annual growth for the equal-weight S&P 500. The artificial-intelligence darlings have led the market higher due to supersize growth prospects but now sport supersize valuations of more than 30 times forecast earnings. What it won’t mean is robust economic growth. The Conference Board is forecasting 1.3% growth in U.S. gross domestic product in 2026, below the Fed’s most recent outlook for 1.6% growth, published in June. At the same time, inflation is likely to remain elevated, partly due to tariffs. Higher prices could put a dent in consumer spending and corporate profits. *This content is developed from sources believed to be providing accurate information. It may not be used for the purpose of avoiding any federal tax penalties. Please consult legal or tax professionals for specific information regarding your individual situation. The opinions expressed and material provided are for general information, and should not be considered a solicitation for the purchase or sale of any security. |
|
|
|
|
|